APPLIED FIELD WORK
Qualitative and Quantitative Data
Qualitative data is something that can't be measure for example an opinion.
Quantitative data is information about quantities; that is, information that can be measured and written down with numbers for example the width of a beach or the angle of a cliff.
Qualitative data is something that can't be measure for example an opinion.
Quantitative data is information about quantities; that is, information that can be measured and written down with numbers for example the width of a beach or the angle of a cliff.
Primary and Secondary Data
Primary data is original research that is obtained through first-hand investigation for example measuring the width of a stone.
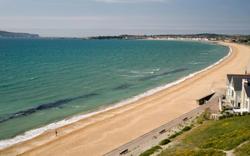
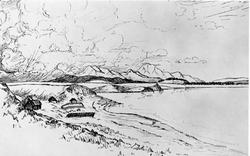
Secondary data is research that is widely available and obtained from another party for example looking at the sketch of the beach.
Primary data is original research that is obtained through first-hand investigation for example measuring the width of a stone.
Secondary data is research that is widely available and obtained from another party for example looking at the sketch of the beach.
Random Data, Stratified Data and Systematic Data
A random sample is a subset of a population selected by a process that makes all samples of a specified size equally likely to occur. In statistics, you use a random sample to make generalizations, or inferences, about a population.
A stratified sample is made up of different 'layers' of the population, for example, selecting samples from different age groups. The sample size for each layer is proportional to the size of the 'layer'. This is shown in the following equation:
Sample size for each layer = size of whole sample/size of population × size of layer
So we look at what fraction of the whole population do we want. Then take that fraction of each layer.
Systematic sampling is a type of probability sampling method in which sample members from a larger population are selected according to a random starting point and a fixed periodic interval.
A transect is a line following a route along which a survey or observations are made. The transect is an important geographic tool for studying changes in human and/or physical characteristics from one place to another.
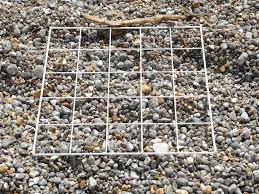
The Size and shape of pebbles
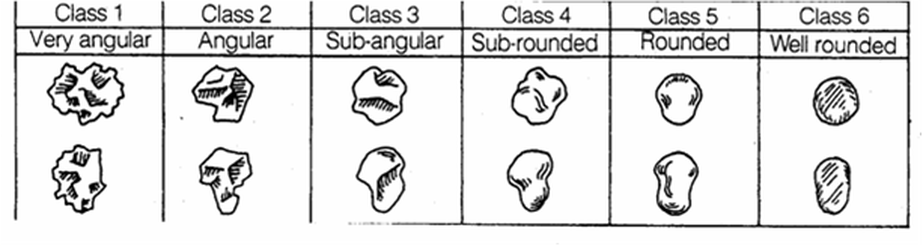
On our field trip we measured the width length and depth off pebbles every three meters using a caliper. At each 3 meter point we put down a quadrat and chose a pebble from each corner of the quadrat and repeated this for every 3 meter point.
|

|
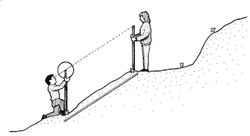
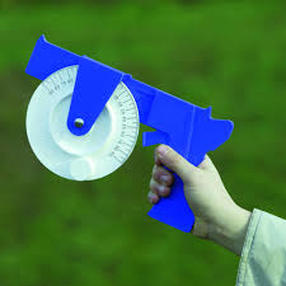
When we were measuring the slope of the beach we used a gun clinometer. When put a meter stick on each 3 meter point and aimed the gun clinometer from one stick to the next and measured the angle.
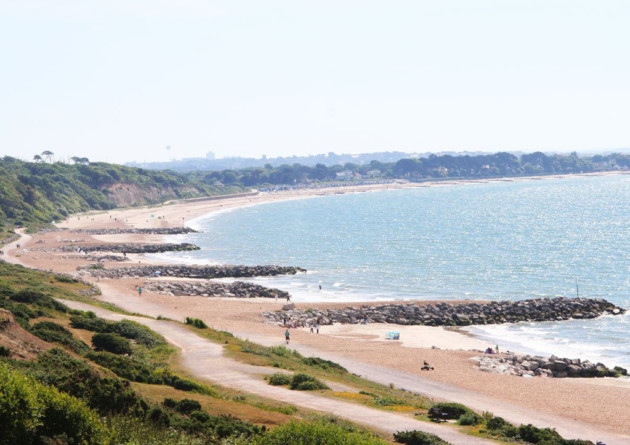
Null Hypothesis for Highcliff Fieldwork
Long shore drift does not go from west to east.
Long shore drift does not go from west to east.
What we Did
We split into 5 groups and recorded a transect from different position on the beach to try and contradict our null hypothesis.
We split into 5 groups and recorded a transect from different position on the beach to try and contradict our null hypothesis.
Transects of The Beach
The data that we collected did not prove that long shore drift happens from west to east therefore the null hypothesis was correct. Transect 1 was on the west side of the beach and transect 5 was on the east. To prove that long shore drift occurs from west to east the height of the transect should increase as you go from 1 to 5. However this did not happen which shows are data does not prove that long shore happens from west to east.
